
DPA1: Discover the Hidden Power of Chrome Developer Tools
Monday, October 9th, 2017
Presented by RJ Bruneel
Chrome Developer Tools is a great tool for inspecting and debugging code, but it is capable of so much more. For example, did you know you can modify CSS/SCSS code in Chrome and automatically save your changes to the corresponding CSS file? Chrome Developer Tools can be intimidating and there is a steep learning curve making it difficult to discover all the buried features. Let’s face it most of us don’t have the time to take a deep dive into all that Chrome Developer Tools has to offer. You will come out of this presentation with new tools to accompany your development arsenal. I will show you how to debug and profile Javascript code in real time, how to view the hover state without hovering and other hidden gems. You will be amazed, as I was, with the hidden features and tools buried within the complex Chrome Developer Tools user interface.
 Notes
Notes
So, I’ve been using firebug for so long that I am hesitant to change. That said, Firefoxs propensity to crash has been really ticking me off lately. Let’s look at Chromes options…
- Lots of settings:
- Blackbox
- Mobile device pre settings
- throttling (to pretend to be a slow connection)
- Keyboard shortcuts
- Unless you set up a workspaces, changes will not persist.
- Console:
- document.designMode = “on” (to edit directly in the page)
- Can turn on/off hover states
- Pretty print
- unminifies JS and CSS
- Ctrl D: edit multiple lines at once.
- Network tab: Throttle
- Performance tab: Similar to network, but you can throttle CPU as well as network!
- Can record interactions and debug slow code
- Console:
- simply jquery built in – or – use your own
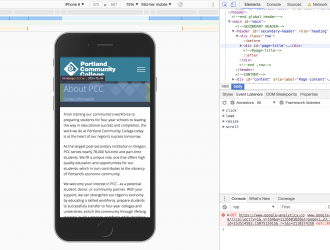
- Mobile development:
- Little icon in top left to switch to devices.
- Can switch orientation
- Can see breakpoints, and even phone orientation.